Credit: NASA · NASA material is generally not copyrighted; items carrying a third-party or copyright credit are excluded. The NASA logo and insignia are never reused.
NASA
Earth Observatory
Science
Earth Observatory
Antarctic Sea Ice Grows to Its…
Earth
Earth Observatory
Image of the Day
EO Explorer
Topics
All Topics
Atmosphere
Land
Heat & Radiation
Life on Earth
Human Dimensions
Natural Events
Oceans
Remote Sensing Technology
Snow & Ice
Water
More Content
Collections
Global Maps
World of Change
Articles
Earth Matters Blog
Blue Marble: Next Generation
EO Kids
Mission: Biomes
About
About Us
Subscribe
🛜 RSS
Contact Us
Search
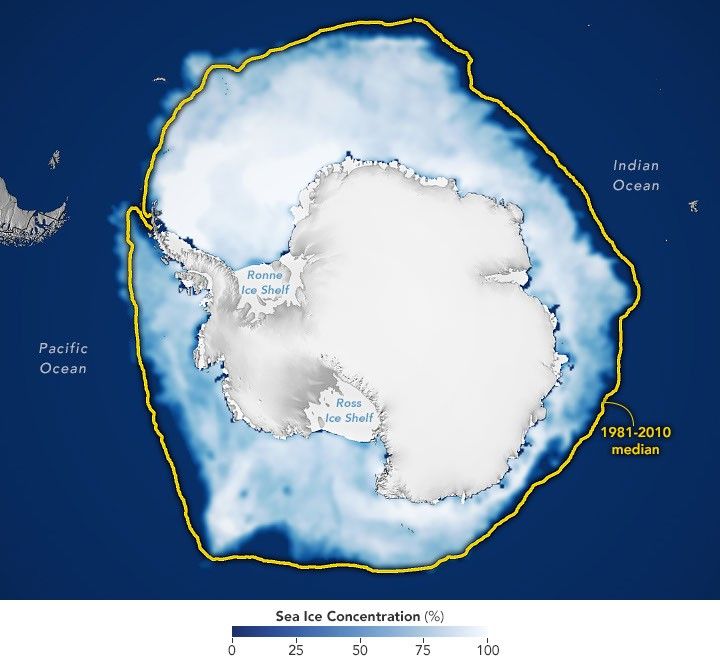
Antarctic sea ice reached its annual maximum extent on September 14, 2026—the third-lowest maximum in the satellite record.
NASA Earth Observatory/Michala Garrison
This story is an update to the Antarctic sea ice feature in our World of Change series tracking long-term change on Earth’s surface through satellite imagery.
Unlike the Arctic—an ocean basin surrounded by land—the Antarctic is a large continent surrounded by an ocean. Because of this geography, sea ice has more room to expand during the winter. However, that ice also stretches into warmer latitudes, leading to more melting in the summer. Antarctic sea ice usually peaks in September, around the end of the Southern Hemisphere’s winter, and retreats to a minimum in February.
According to NASA and the National Snow and Ice Data Center (NSIDC), Antarctic sea ice in 2026 likely reached its annual maximum extent on September 14 (above). On that date, the ice covered an estimated 17.59 million square kilometers (6.79 million square miles), making it the third-lowest maximum on record.
The maps below show the average concentration of Antarctic sea ice for the month of September (left) and the following February (right) from 1990 to 2026. Opaque white areas indicate the highest concentrations, and dark blue areas are open water. The images include only areas where ice concentration was at least 15 percent, a threshold scientists commonly use to count an area as ice-covered in satellite data. Scientists refer to the total area of these regions as the “sea ice extent.”
1990-1991
1991-1992
1992-1993
1993-1994
1994-1995
1995-1996
1996-1997
1997-1998
1998-1999
1999-2000
2000-2001
2001-2002
2002-2003
2003-2004
2004-2005
2005-2006
2006-2007
2007-2008
2008-2009
2009-2010
2010-2011
2011-2012
2012-2013
2013-2014
2014-2015
2015-2016
2016-2017
2017-2018
2018-2019
2019-2020
2020-2021
2021-2022
2022-2023
2023-2024
2024-2025
2025-2026
From Record Highs to Record Lows
From 1979 until 2014, total Antarctic sea ice increased by about 1 percent per decade. Whether the increase was a sign of meaningful change is uncertain because ice extents vary considerably from year to year around Antarctica. For three consecutive years, from 2012 to 2014, satellites observed new record highs for winter sea ice extent. These highs occurred while Arctic ice was in steep decline.
The climb came to an end in 2015, and significant decreases in sea ice around Antarctica started to occur in 2016. There have since been years with small rebounds, but overall, Antarctic sea ice coverage has largely remained lower than normal. Both the record low minimum and record low maximum occurred in 2023. Scientists will continue to observe the area each year to find out if the decline is part of a long-term change or a statistical fluctuation.
Seeing Through the Clouds
To determine sea ice extent, scientists rely on satellites with passive microwave sensors that measure the microwave energy Earth naturally emits. Sea ice emits more of this energy than open water, so it stands out in microwave images. Because microwaves pass through clouds, the satellites can observe sea ice regularly, regardless of weather.
The record began in late 1978 with data collected by NASA’s Nimbus-7, followed by Defense Meteorological Satellite Program (DMSP) satellites starting in 1987, and by NASA’s Aqua satellite between 2002 and 2011. In 2025, scientists began using observations from the Japan Aerospace Exploration Agency’s GCOM-W satellite.
NASA Earth Observatory images by Michala Garrison, using data from the National Snow and Ice Data Center.
Downloads
September 14, 2026
JPEG (682.33 KB)
References & Resources
NASA Earthdata (2026, October) Sea Ice. Accessed October 8, 2026.
NASA Earth Observatory (2026, October 6) World of Change: Antarctic Sea Ice. Accessed October 8, 2026.
NASA Earth Observatory (2016, September 16) Sea Ice. Accessed October 8, 2026.
NASA Earth Science (2026, September 23) Arctic Sea Ice Reaches 2026 Annual Minimum Extent. Accessed October 8, 2026.
National Snow and Ice Data Center (2026, September 23) Arctic sea ice has reached minimum extent for 2026; Antarctic sea ice maximum most likely reached as well. Accessed October 8, 2026.
National Snow and Ice Data Center (2026, March 9) Antarctic sea ice extent arrives at a near-average minimum. Accessed October 8, 2026.
You may also be interested in:
Stay up-to-date with the latest content from NASA as we explore the universe and discover more about our home planet.
Arctic Sea Ice Shrinks to Its 2026 Minimum
4 min read
Satellite records show Arctic sea ice covering less of the ocean in both winter and summer.
Article
A Changing World for Emperor Penguins
7 min read
Experts are analyzing decades of images from Landsat satellites for clues about how the iconic birds have responded to sea…
Article
Pink Penguin Guano Provides Diet Clues
3 min read
The color of Adélie penguin droppings reveals what the birds are eating, offering scientists a way to track how sea…
Article
1
2
3
4
Next
Keep Exploring
Discover More from NASA Earth Science
Subscribe to Earth Observatory Newsletters
Subscribe to the Earth Observatory and get the Earth in your inbox.
Earth Observatory Image of the Day
NASA’s Earth Observatory brings you the Earth, every day, with in-depth stories and stunning imagery.
Explore Earth Science
Earth Science Data
Open access to NASA’s archive of Earth science data