Credit: NASA · NASA material is generally not copyrighted; items carrying a third-party or copyright credit are excluded. The NASA logo and insignia are never reused.
NASA
Earth Observatory
Science
Earth Observatory
Hunting Red Leaves with…
Earth
Earth Observatory
Image of the Day
EO Explorer
Topics
All Topics
Atmosphere
Land
Heat & Radiation
Life on Earth
Human Dimensions
Natural Events
Oceans
Remote Sensing Technology
Snow & Ice
Water
More Content
Collections
Global Maps
World of Change
Articles
Earth Matters Blog
Blue Marble: Next Generation
EO Kids
Mission: Biomes
About
About Us
Subscribe
🛜 RSS
Contact Us
Search
September 29 to October 4
October 5 to 11
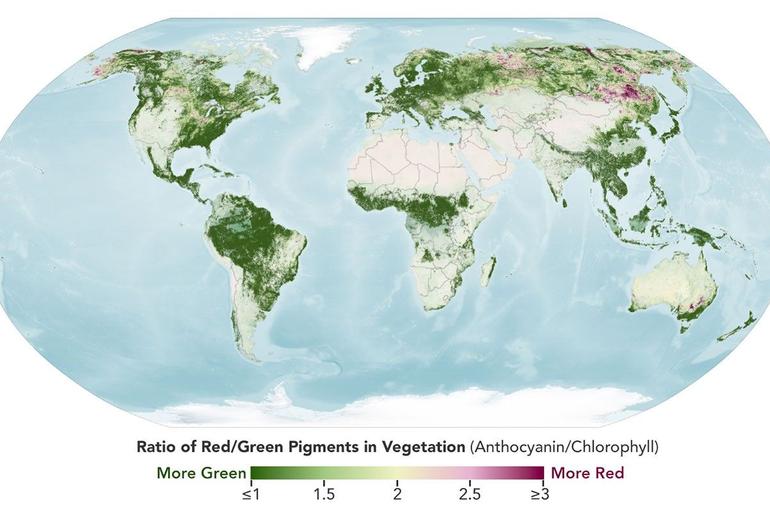
A map depicts vegetated parts of Earth’s land surfaces from September 29 to October 4. Vegetation color is depicted on a spectrum ranging from dark green to light yellow to dark red. The largest patches of red vegetation appear in Alaska, northern Canada, Mongolia, and Russia. Smaller patches of red are visible in Australia.
NASA Earth Observatory / Lauren Dauphin
A similar global map depicts the redness of vegetation from October 5 to 11. The reddest areas have shifted equatorward, with more color visible in the Mid-Atlantic, the U.S. Southeast, southern Russia, China, and Mongolia.
NASA Earth Observatory / Lauren Dauphin
September 29 to October 4October 5 to 11
A map depicts vegetated parts of Earth’s land surfaces from September 29 to October 4. Vegetation color is depicted on a spectrum ranging from dark green to light yellow to dark red. The largest patches of red vegetation appear in Alaska, northern Canada, Mongolia, and Russia. Smaller patches of red are visible in Australia.
NASA Earth Observatory / Lauren Dauphin
A similar global map depicts the redness of vegetation from October 5 to 11. The reddest areas have shifted equatorward, with more color visible in the Mid-Atlantic, the U.S. Southeast, southern Russia, China, and Mongolia.
NASA Earth Observatory / Lauren Dauphin
September 29 to October 4
October 5 to 11
CurtainToggle2-Up
Image Details
These maps show the redness of vegetation as measured by the OCI (Ocean Color Instrument) on the PACE (Plankton, Aerosol, Cloud, ocean Ecosystem) satellite in September and October 2026. Red foliage appears to peak in New England, northern Canada, and northern Russia from September 29 to October 4, then spreads southward into the Mid-Atlantic, Mongolia, and northern China from October 5 to 11 (right).
The Japanese tradition of momijigari, or “red leaf hunting,” stretches back more than a millennium, as evidenced by ancient poems describing journeys to admire fall foliage. In America, mentions of foliage trips began appearing in the historical record in the 19th century, around the time artists and poets such as Frederic Church and Emily Dickinson celebrated autumn color in depictions of the Northeast.
Modern-day leaf peepers have a new way to track and savor the seasonal phenomenon. The hyperspectral OCI (Ocean Color Instrument) on NASA’s PACE (Plankton, Aerosol, Cloud, ocean Ecosystem) satellite observes the planet’s oceans and vegetation daily at 286 spectral bands. Among this array are a few groups of wavelengths that allow scientists to track subtle changes in leaf pigments key to fall foliage displays, including anthocyanins (reds), carotenoids (yellows and oranges), and chlorophylls (greens).
NASA scientists can track fall color by measuring how much red, orange, and yellow forests show compared with green. Tracking the ratio over time reveals where leaves are changing and when color peaks. The maps above show vegetation “redness” from September 29 to October 4 (left) and October 5 to 11 (right). Areas shown in green have values near 1, meaning the satellite detects about as much red as green, and most leaves have not yet turned. Areas shown in light yellow and red have higher values, indicating progressively more red pigment relative to green.
The satellite detected particularly high levels of redness in parts of northern and eastern Russia, northern Alaska, and northern Canada from September 29 to October 4. In New England and upstate New York, redness began to fade during the week of October 5 to 11, even as it spread across much of the Midwest and the Mid-Atlantic. (Not all the yellows and reds on the maps represent fall colors. Crops in some agricultural areas, for instance, show high anthocyanin levels as they age and after they are harvested. Also, in some regions, clouds produce what appear to be gaps in the vegetation.)
Seeing Red in Vermont
Many of the reddest areas—such as the Adirondacks in New York, the Green Mountains in Vermont, and the White Mountains in New Hampshire—have large numbers of sugar maples (Acer saccharum) and red maples (Acer rubrum), deciduous trees that turn a brilliant shade of crimson in the fall. Blueberries, bilberries, sedges, mosses, and grasses likely contribute to the intense reds detected in marshy tundra areas in northern Alaska, Canada, and Russia.
Red and orange hues cover the forested ridges of central Vermont, while river valleys and lower-elevation areas are still green. The OLI (Operational Land Imager) on Landsat 9 captured this image on October 3, 2026.
NASA Earth Observatory / Lauren Dauphin
The OLI (Operational Land Imager) on Landsat 9 captured an image (above) of intensely red foliage around Ripton, Vermont, on October 3, 2026, around the peak of redness in the region. Poet Robert Frost, author of “October,” “The Road Not Taken,” “Nothing Gold Can Stay,” and several other poems that evoke fall foliage, kept a summer home and farm in Ripton and taught at Middlebury’s Bread Loaf School of English.
Some other satellites with hyperspectral sensors can measure fall foliage pigments in a way that is similar to PACE, but only in more localized areas and less frequently. PACE is the first satellite capable of measuring all three key leaf pigments—anthocyanins, carotenoids, and chlorophylls—across the entire planet every day or two.
“It’s the ability to collect time-series data of anthocyanins and carotenoids everywhere on Earth repeatedly that is game-changing,” said Karl Huemmrich, a vegetation scientist with the Goddard Earth Sciences Technology and Research II center at the University of Maryland, Baltimore County. Huemmrich, who is also a member of the PACE science team, was eager to work with the satellite because of OCI’s broad swath and short revisit time. “The time-series data allow us to determine peak redness and yellowness anywhere on Earth,” he said.
In the fall, leaves change colors as they lose chlorophyll, a green molecule that plants use to synthesize food. Since chlorophyll is not a stable compound, plants must continuously synthesize it, a process that requires ample sunlight and warm temperatures. As temperatures decrease and days shorten in autumn, levels of chlorophyll drop, causing greens to fade and presenting an opportunity for carotenoids and anthocyanins to show their colors.
Observing Leaves in a Canopy Near You
As part of the ongoing North American Phenology Campaign run by the Global Learning and Observations to Benefit the Environment (GLOBE) program, NASA data scientist Skye Caplan has been posting weekly foliage maps of vegetation redness. The maps show waves of red emerging in the high latitudes in August and shifting equatorward in September and October. The PACE team is asking the public to submit photos of fall foliage to help scientists “ground truth” the satellite observations and better understand how various factors influence vegetation color.
Fall foliage sprinkles a forested New England landscape in a photo taken in Meredith, New Hampshire, on October 11, 2026, by a participant in GLOBE’s North America Phenology Campaign.
GLOBE
“Changes in pigments can also occur when vegetation is stressed due to drought or insect damage,” said Caplan. She noted that changes like these likely help explain why PACE measures high levels of redness in agricultural regions of Brazil, Australia, and Canada that don’t track closely with broader seasonal changes.
“The more photos we can get from the ground, the better,” Caplan said. Ground photos help scientists refine PACE’s observations of vegetation color, which the team hopes will eventually support several lines of research. These include how the timing of spring greening and fall senescence is changing, how vegetation changes affect the global carbon cycle, and how leaf color influences wildfire risk. Scientists also want to know whether PACE can detect early warning signs of drought, insect infestations, and plant disease.
People can participate in the GLOBE campaign even if they live in an area without dense forests or picturesque fall foliage displays. Scientists also want ground observations of shrubs, grasses, wildflowers, evergreens, crops, and other vegetation. But when it comes to “red leaf hunting,” don’t delay, Caplan said. “Color changes happen kind of slowly, then all at once, and then they’re gone.”
NASA Earth Observatory images by Lauren Dauphin, using PACE data courtesy of Skye Caplan/NASA’s Goddard Space Flight Center and Landsat data from the U.S. Geological Survey. Photo courtesy of the GLOBE Program. Story by Adam Voiland.
Downloads
September 29 – October 4, 2026
JPEG (3.12 MB)
October 5 – October 11, 2026
JPEG (3.10 MB)
Landsat 9: October 3, 2026
JPEG (4.44 MB)
References & Resources
Caplan, S. & Huemmrich, F. (2025) Unveiling PACE OCI’s hyperspectral terrestrial data products. Remote Sensing Letters, 16(4), 422-433.
GLOBE Program (2026, October 18) PACE Fall Foliage Updates. Accessed October 22, 2026.
GLOBE Program (2026) North America Phenology Campaign. Accessed October 22, 2026.
GLOBE Program (2026, September 22) Tracking Fall Color with PACE. Accessed October 22, 2026.
Huemmrich, K. et al. (2026) Observing fall foliage with PACE pigment indices. Remote Sensing Letters, 17(6), 853-863.
Mental Floss (2024, August 20) A Brief History of Leaf-Peeping. Accessed October 22, 2026.
NASA Scientific Visualization Studio (2025) Global Views of PACE Land Vegetation Data. Accessed October 22, 2026.
UMBC (2026, June 12) For the leaf peepers: How NASA’s PACE is improving fall color forecast. Accessed October 22, 2026.
Veltra (2025) Autumn in Japan: The Cultural Meaning of Kōyō (紅葉) & Momijigari. Accessed October 22, 2026.
You may also be interested in:
Stay up-to-date with the latest content from NASA as we explore the universe and discover more about our home planet.
An Early Look at Fall Color in Canada
3 min read
Reds, yellows, and oranges are already sweeping across tundra landscapes in Nunavut.
Article
Autumn Paints Poland’s Bieszczady Mountains
3 min read
Fall color covers the forested slopes of Bieszczady National Park, while patches of polonina, a type of high-mountain meadow, have…
Article
Wild, Scenic, and Increasingly Rusty
5 min read
Orange streams are now being spotted in hundreds of watersheds in permafrost areas throughout Alaska’s Brooks Range.
Article
1
2
3
4
Next
Keep Exploring
Discover More from NASA Earth Science
Subscribe to Earth Observatory Newsletters
Subscribe to the Earth Observatory and get the Earth in your inbox.
Earth Observatory Image of the Day
NASA’s Earth Observatory brings you the Earth, every day, with in-depth stories and stunning imagery.
Explore Earth Science
Earth Science Data
Open access to NASA’s archive of Earth science data