Ceasefire talks resume as negotiators arrive for a second round
Signal Bulletin report
NASA Satellites Observe Historic 2026 El Niño
A phenomenon rarer than a solar eclipse and more powerful than any single storm system is unfolding this fall, and NASA is tracking it closely. El Niño is a…
Author not supplied
· Published 15 Oct 2026, 18:51 · Updated 15 Oct 2026, 18:51
Credit: NASA · NASA material is generally not copyrighted; items carrying a third-party or copyright credit are excluded. The NASA logo and insignia are never reused.
NASA
6 Min Read
NASA Satellites Observe Historic 2026 El Niño
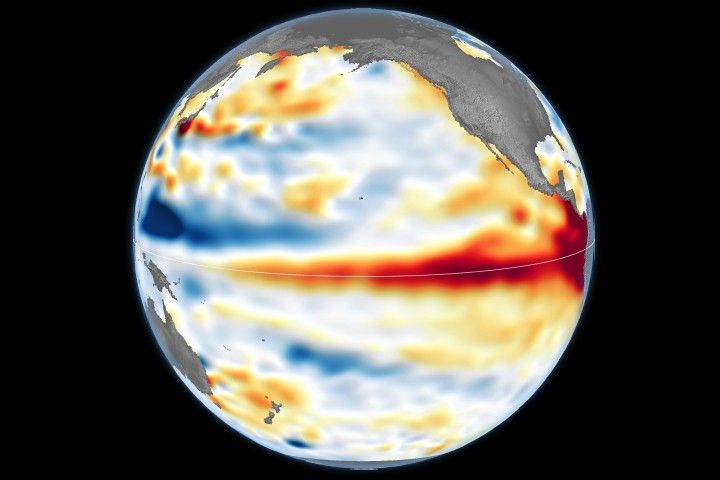
This visualization compares three ocean data products, sea surface temperature anomaly, apparent visible wavelength, and sea surface height anomaly, over the same months in 2025 and 2026. Signals of El Niño in each map are highlighted with pop-up labels.
Credits:
NASA’s Scientific Visualization Studio
A phenomenon rarer than a solar eclipse and more powerful than any single storm system is unfolding this fall, and NASA is tracking it closely.
El Niño is a natural climate pattern that emerges roughly every two to seven years marked by warmer-than-normal water temperatures in parts of the equatorial Pacific. NASA scientists are keeping watch as it flips trade winds, redistributes ocean heat, scrambles rain patterns, and raises sea surface height across parts of the Pacific.
As of October, the National Oceanic and Atmospheric Administration (NOAA) has said that there’s an 83% chance that the strongest El Niño since 1950 is currently unfolding. People around the world, including farmers, firefighters, and coastal communities, are already experiencing the effects in different ways.
Follow along with these maps as NASA tracks El Niño from its epicenter in the equatorial Pacific Ocean.
Sea surface height in flux
Lower-than-normal sea level conditions appear blue, and higher areas are orange and red in this map, which compares the ocean in 2025 (a weak La Niña year) and 2026. The map was created using altimetry data from the Sentinel-6 satellites, which measure water height for the entire ocean every 10 days, down to fractions of an inch.
Credit: NASA’s Scientific Visualization Studio
One of the first clues appeared in satellite imagery in January 2026, when a swell of warm water called a Kelvin wave was spotted near Micronesia in the western Pacific. Kelvin waves are slow-moving pulses of water thousands of miles long. Like underwater freeways, they transfer heat from west to east across the Pacific. The warm water heats the air directly above it, making it rise. The change in air pressures weakens or even reverses the trade winds that typically blow in the opposing direction, from the Americas toward Asia, causing sea levels in the eastern Pacific to rise further, and waters to warm even more. This chain reaction signifies the start of an El Niño.
The map above shows that by early April, those Kelvin waves had reached the eastern Pacific, and sea surface temperatures had begun to warm. Warm water expands in volume, elevating local sea levels in some areas by as much as 1 to 1.3 feet (30 to 40 centimeters). The higher-than-normal water can be seen sloshing toward South America then moving up the coast to California. Sea levels that are six to eight inches (15 to 20 centimeters) lower than normal are visible around Indonesia and northern Australia.
“Kelvin waves are like the heartbeat of El Niño,” said Josh Willis, project scientist for sea level missions at NASA’s Jet Propulsion Laboratory in Southern California. “And our sea level satellites let us peer into the ocean and watch every beat.”
Scientists have used satellite altimetry to track the height of the ocean with ultraprecision since 1993. That unbroken data record continues today with the Sentinel-6 satellites. State-of-the-art radar altimeters aboard these satellites survey millions of square miles of ocean in a single day, complementing NOAA’s fleet of ocean sensors and buoys drifting and diving through the water below.
Warming Pacific waters
The map above compares sea surface temperatures in 2025 (a weak La Niña year) and 2026. Data are acquired from satellite instruments, buoys, and ship sensors.
Credit: NASA’s Scientific Visualization Studio
Warmer-than-normal seawater is one of the best-known indicators of El Niño. Already, sea surface temperatures in the eastern Pacific are about 3 degrees Fahrenheit (1.7 degrees Celsius) warmer than the long-term average and could jump another fraction of a degree in the coming months, Willis said.
Satellites carrying microwave and infrared radiometers can see through and around clouds to measure heat energy at the sea surface. Satellites in 2026 mapped the band of warmer-than-normal water as it expanded throughout the spring. The band, seen in dark red, stretches for millions of square miles from the heart of the Pacific to the coast of South America. Ocean temperatures can influence weather patterns around the world. Air above the water’s surface carries heat and moisture into the atmosphere, seeding rainstorms and rearranging weather patterns across the globe.
Ocean gets bluer
The map above compares Apparent Visible Wavelength from 2025 (a weak La Niña year) and 2026. Apparent Visible Wavelength is a data product from NASA’s PACE satellite utilizing ocean color data from the Ocean Color Instrument.
Credit: NASA’s Scientific Visualization Studio
El Niño’s warm waters also change the color of the ocean. A NASA satellite is tracking these subtle shifts in hues, as equatorial Pacific waters have become measurably more blue over the last several months.
“Some people think of water as being just blue, but it’s amazing the multitude of colors the ocean can be,” said Matthew Kehrli, a lead research scientist for the PACE (Plankton, Aerosol, Cloud, ocean Ecosystem) satellite team at NASA’s Goddard Space Flight Center in Greenbelt, Maryland.
This spectrum is in part thanks to microscopic plants called phytoplankton, which form the basis of the marine food web. There are thousands of different species of phytoplankton, which come in shades like teal, brown, or green. This year, in areas of the Pacific Ocean along the equator that are typically lush with phytoplankton and greener as a result, these hues are waning.
This is an expected effect of El Niño. Phytoplankton thrive in cool, nutrient-rich waters, but during an El Niño, the weakening trade winds reduce the upwelling of nutrient-rich deep water to the ocean surface. With limited food supply, phytoplankton abundance drops. This decline can trigger cascading effects across the marine food web, forcing other marine life to relocate to new feeding grounds.
This year’s El Niño is the first since PACE launched in 2024, providing new views of the phenomenon. The Ocean Color Instrument aboard PACE observes the ocean in hyperspectral color — across several hundred different wavelengths of visible, near-infrared, and ultraviolet light — monitoring phytoplankton and other ocean-color changes in near-real time. With PACE data, researchers calculate the average color of the ocean, simplifying spectra of light into a single number, known as apparent visible wavelength.
The 2026 map above shows the green area along the equator in the western Pacific Ocean shrink as a bluer shade fills in, indicating fewer phytoplankton. In contrast, the map from 2025 shows how the green-hued section stays steady over time.
“You have expectations of what you would think would happen,” Kehrli said. “But to visually see the results with the data products that you’re working with in real time is gratifying.”
NASA scientists will continue to monitor the signs and impacts of this El Niño with its fleet of Earth-observing satellites.
“El Niño touches almost all of us in some way every time it occurs,” Willis said. “While many have seen what it can do, we look to the ocean to understand why.”
View and download these data visualizations here.
Share
Details
Last Updated
Oct 15, 2026
Editor
Jenny Marder
Contact
Sally Younger
Jenny Marder
jenny.marder@nasa.gov
Erica McNamee
erica.s.mcnamee@nasa.gov
Location
NASA Goddard Space Flight Center
Related Terms
Earth
El Niño – Southern Oscillation
Goddard Space Flight Center
Jet Propulsion Laboratory
Oceans
PACE (Plankton, Aerosol, Cloud, Ocean Ecosystem)
Sentinel-6 Michael Freilich Satellite
Explore More
4 min read
El Niño Is Underway
Satellite observations of sea surface height indicated that the 2026 event continued to strengthen in…
Article
4 months ago
5 min read
El Niño Alters Marine Life in the Pacific
Satellite measurements of chlorophyll at the sea surface signal shifts in the ocean’s nutrient supplies…
Article
2 months ago
3 min read
A Subtle Return of La Niña
A weak La Niña emerged in the equatorial Pacific in late 2025, and scientists are…
Article
10 months ago
Keep Exploring
Discover More Topics From NASA
Missions
Humans in Space
Climate Change
Solar System